This article is for investors who would like to improve their understanding of price to earnings ratios (P/E ratios). To keep it practical, we’ll show how Microsoft Corporation’s (NASDAQ:MSFT) P/E ratio could help you assess the value on offer. Based on the last twelve months, Microsoft’s P/E ratio is 26.51. That means that at current prices, buyers pay $26.51 for every $1 in trailing yearly profits.
Check out our latest analysis for Microsoft
How Do I Calculate Microsoft’s Price To Earnings Ratio?
The formula for P/E is:
Price to Earnings Ratio = Price per Share ÷ Earnings per Share (EPS)
Or for Microsoft:
P/E of 26.51 = $135.56 ÷ $5.11 (Based on the trailing twelve months to June 2019.)
Is A High P/E Ratio Good?
A higher P/E ratio means that buyers have to pay a higher price for each $1 the company has earned over the last year. All else being equal, it’s better to pay a low price — but as Warren Buffett said, ‘It’s far better to buy a wonderful company at a fair price than a fair company at a wonderful price.’
Does Microsoft Have A Relatively High Or Low P/E For Its Industry?
The P/E ratio indicates whether the market has higher or lower expectations of a company. The image below shows that Microsoft has a lower P/E than the average (48.5) P/E for companies in the software industry.
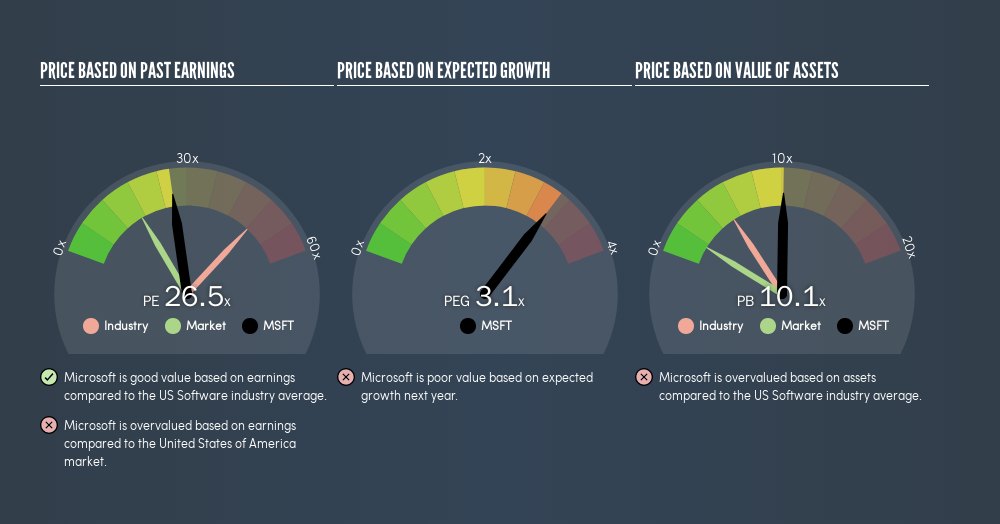
This suggests that market participants think Microsoft will underperform other companies in its industry.
How Growth Rates Impact P/E Ratios
P/E ratios primarily reflect market expectations around earnings growth rates. If earnings are growing quickly, then the ‘E’ in the equation will increase faster than it would otherwise. That means even if the current P/E is high, it will reduce over time if the share price stays flat. Then, a lower P/E should attract more buyers, pushing the share price up.
Microsoft’s 138% EPS improvement over the last year was like bamboo growth after rain; rapid and impressive. And earnings per share have improved by 25% annually, over the last three years. So you might say it really deserves to have an above-average P/E ratio.
Remember: P/E Ratios Don’t Consider The Balance Sheet
Don’t forget that the P/E ratio considers market capitalization. Thus, the metric does not reflect cash or debt held by the company. The exact same company would hypothetically deserve a higher P/E ratio if it had a strong balance sheet, than if it had a weak one with lots of debt, because a cashed up company can spend on growth.
Such expenditure might be good or bad, in the long term, but the point here is that the balance sheet is not reflected by this ratio.
Is Debt Impacting Microsoft’s P/E?
Since Microsoft holds net cash of US$62b, it can spend on growth, justifying a higher P/E ratio than otherwise.
The Verdict On Microsoft’s P/E Ratio
Microsoft’s P/E is 26.5 which is above average (17) in its market. The excess cash it carries is the gravy on top its fast EPS growth. To us, this is the sort of company that we would expect to carry an above average price tag (relative to earnings).
Investors should be looking to buy stocks that the market is wrong about. If the reality for a company is better than it expects, you can make money by buying and holding for the long term. So this free visual report on analyst forecasts could hold the key to an excellent investment decision.
Of course, you might find a fantastic investment by looking at a few good candidates. So take a peek at this free list of companies with modest (or no) debt, trading on a P/E below 20.
We aim to bring you long-term focused research analysis driven by fundamental data. Note that our analysis may not factor in the latest price-sensitive company announcements or qualitative material.
If you spot an error that warrants correction, please contact the editor at editorial-team@simplywallst.com. This article by Simply Wall St is general in nature. It does not constitute a recommendation to buy or sell any stock, and does not take account of your objectives, or your financial situation. Simply Wall St has no position in the stocks mentioned. Thank you for reading.
The easiest way to discover new investment ideas
Save hours of research when discovering your next investment with Simply Wall St. Looking for companies potentially undervalued based on their future cash flows? Or maybe you’re looking for sustainable dividend payers or high growth potential stocks. Customise your search to easily find new investment opportunities that match your investment goals. And the best thing about it? It’s FREE. Click here to learn more.Bagikan Berita Ini


0 Response to "Do You Like Microsoft Corporation (NASDAQ:MSFT) At This P/E Ratio? - Simply Wall St"
Post a Comment